Model Data
The ModelData provides the stellar atmosphere model grid that is used by
MEModel to generate extinguished model spectra.
The ModelData is initialized by providing:
A list of
DATfiles for each stellar atmosphere model included in the grid. These are created by simulating/mocking the observed data formats (see below).The path to the location of the above
DATfiles.The names of the bands desired in the grid. This should be the same as the observed data of interest.
The names of the spectra desired in the grid. This should be the same as the observed data of interest.
The simulated model data is then read in including keeping track of the model parameters Teff, logg, Z (metallicity), and vtrub (turbulent velocity).
By default, models at arbitrary stellar parameters are generated using the nearest 11 neighbors. Such neighbors are defined by a “distance” normalized distance in the model parameter space.
Tlusty Stellar Atmosphere Models
The update in 2025 Ostar and Bstar grids of Tlusty stellar atmosphere models (Hubeny & Lanz 1995) provide good standards, especially of hot, early type stars often used in extinction studies as they are bright in the ultraviolet.
The measure_extinction package provides code to transform the tlusty
SEDs into the same format as the observed data. In other words, it mocks
the spectroscopy and photometry allowing for models to look like they were
observed. The specific code is utils/make_obsdata_from_model.py.
This code uses the ‘merge_obsspec’ functions to transform the model SEDs
to the observed spectral formats.
The utils/make_all_tlusty_obsdata.py runs on the *.flux.gz tlusty files.
Most spectra are simulated/mocked using the appropriate width Gaussian for the line-spread-function (LSF). For some cases, the LSF is known to deviate from a Gaussian and then a numerical LSF is used with the details given below.
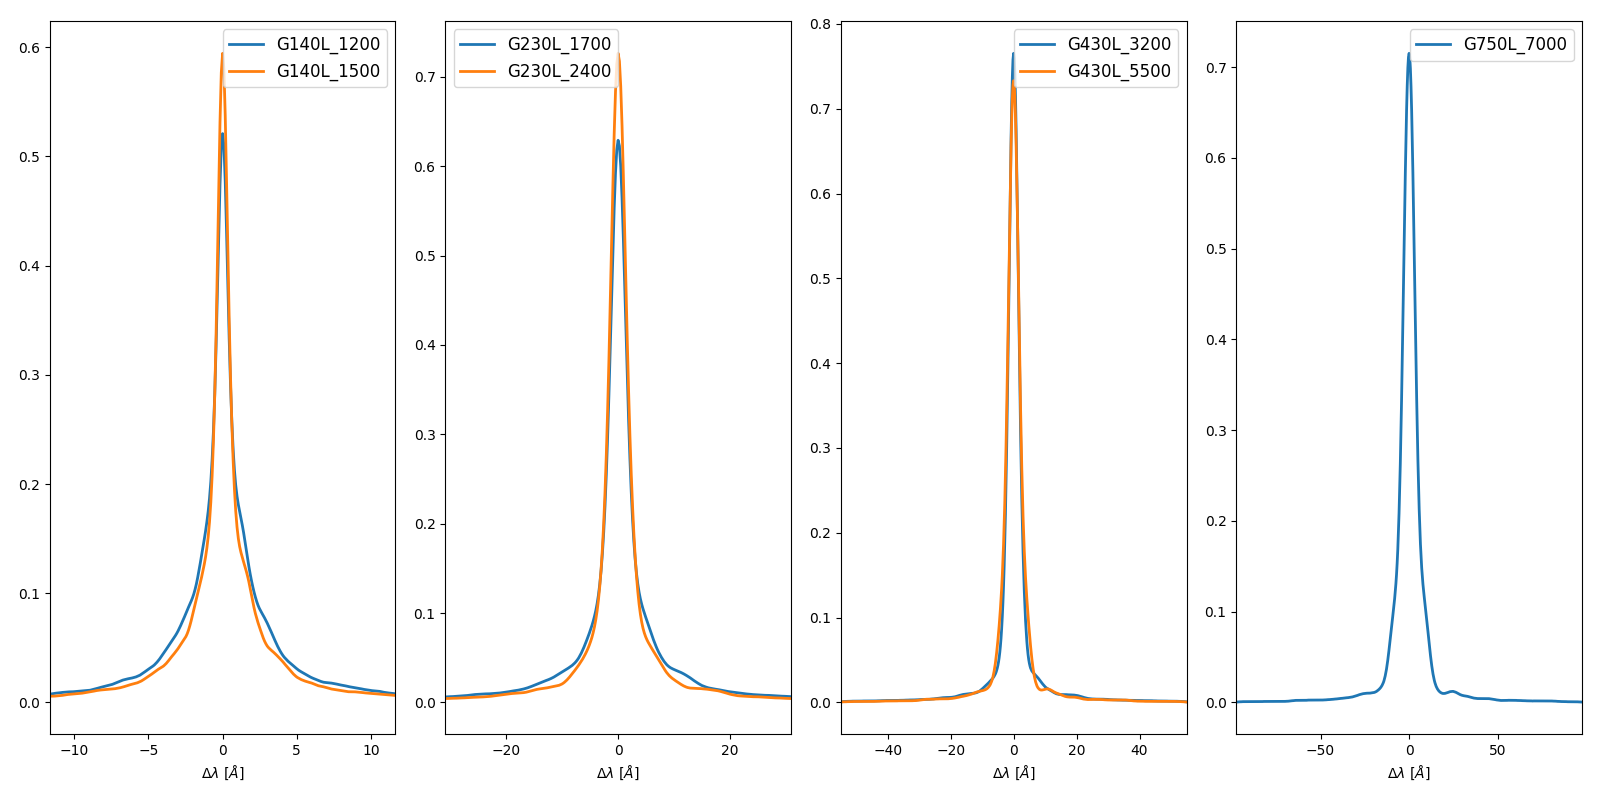
STIS Mocking
The HST STIS observations are simulated by convolving the high spectral
resolution model spectra to the STIS resolution using STIS line-spread-fuctions (LSFs)
retrieved from
STScI.
These line-spread functions are provided at specific wavelengths and are linearly
interpolated/extrapolated for other wavelengths (see utils/mock_spectra_data.py
for details.)
STIS LSFs (52x2 slit):
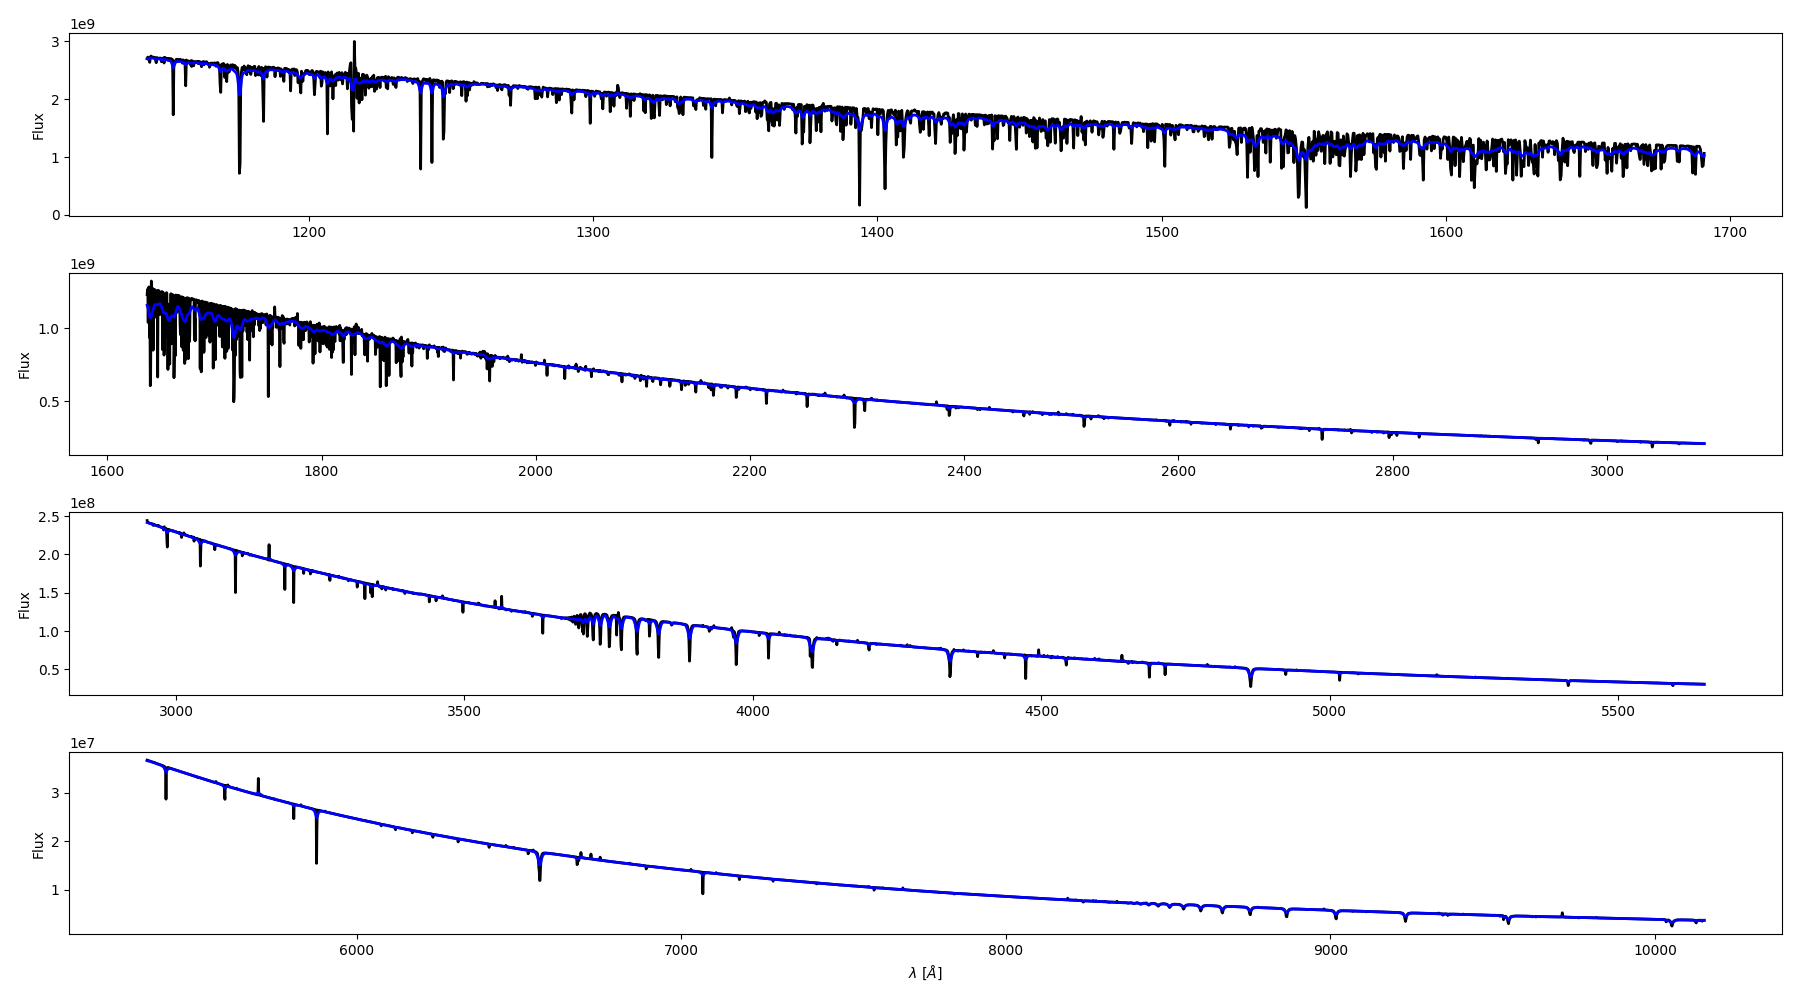
Example of mocked STIS observations for all four low-resolution grating settings: